x <- 1:50
y <- x^2
plot(x,y,col='darkgreen',pch=20)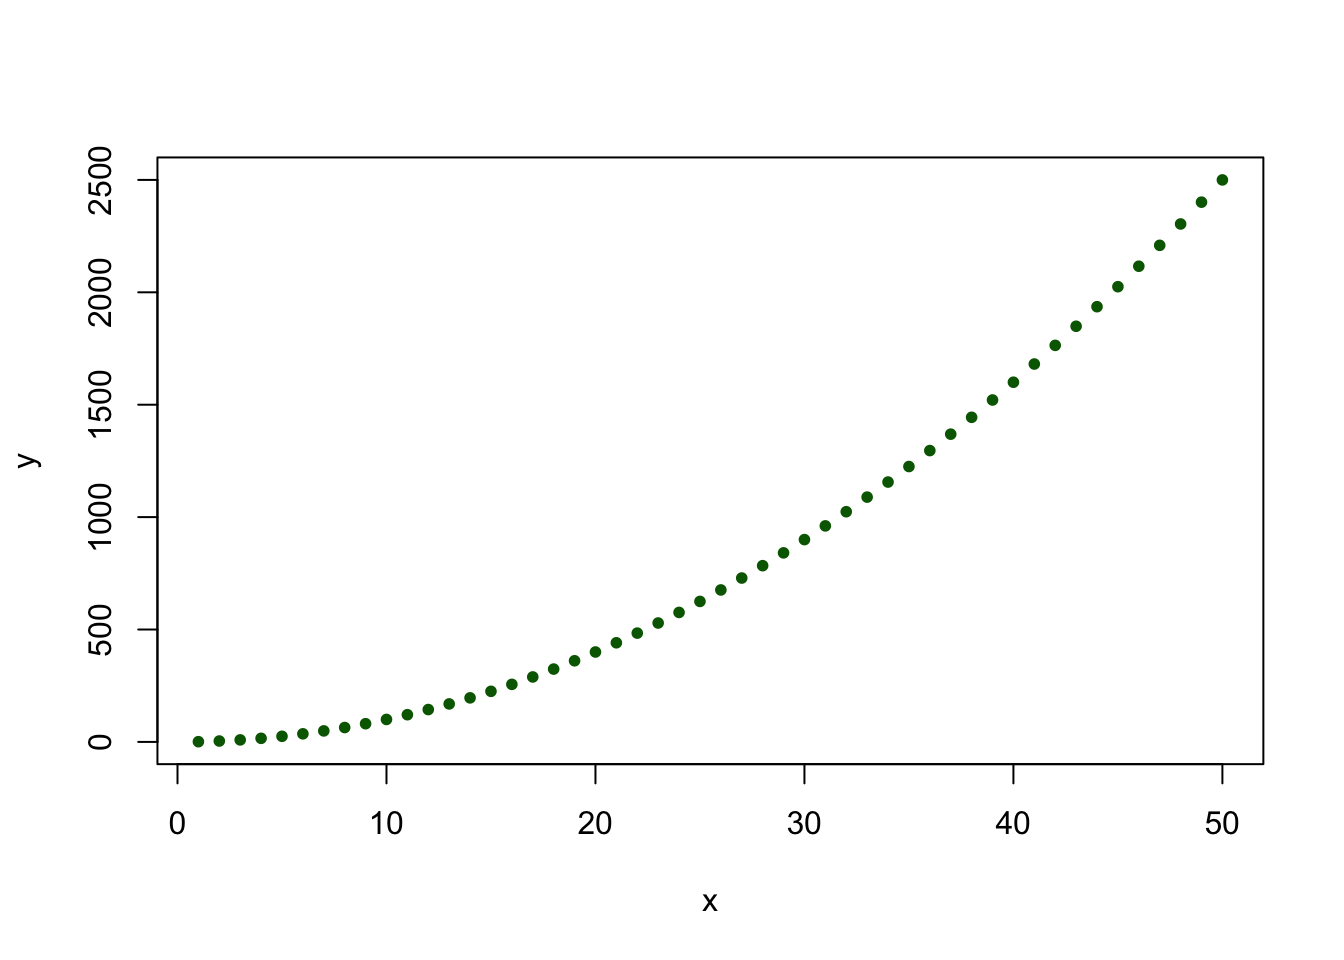
Base R plotting is the original graphics system in R, providing a straightforward and flexible approach to data visualization.
It operates on an “artist’s palette” model, where you start with a blank canvas using high-level functions like plot() to create the initial plot, and then incrementally add elements such as points, lines, and text with low-level functions like points(), lines(), and text() .
This layered approach allows for detailed customization of plots, enabling users to adjust various aspects such as axes, labels, colors, and symbols to suit their specific needs . While base R plotting may require more manual adjustments compared to newer systems like ggplot2, it remains a powerful tool for creating a wide range of static graphics, from simple scatter plots to complex multi-panel figures
x <- 1:50
y <- x^2
plot(x,y,col='darkgreen',pch=20)